Initial Idea
During the Fall 2024 academic quarter, as my Final Project in CS448B: Visualization, I published Let's Bend The Curve, a visual explainer addressing the environmental impact of digital technology.
One of the sources cited in that project was The real climate and transformative impact of ICT: A critique of estimates, trends, and regulations, which revealed that networks may contribute between 22% and 35% of emissions in the Information and Communication Technology sector:
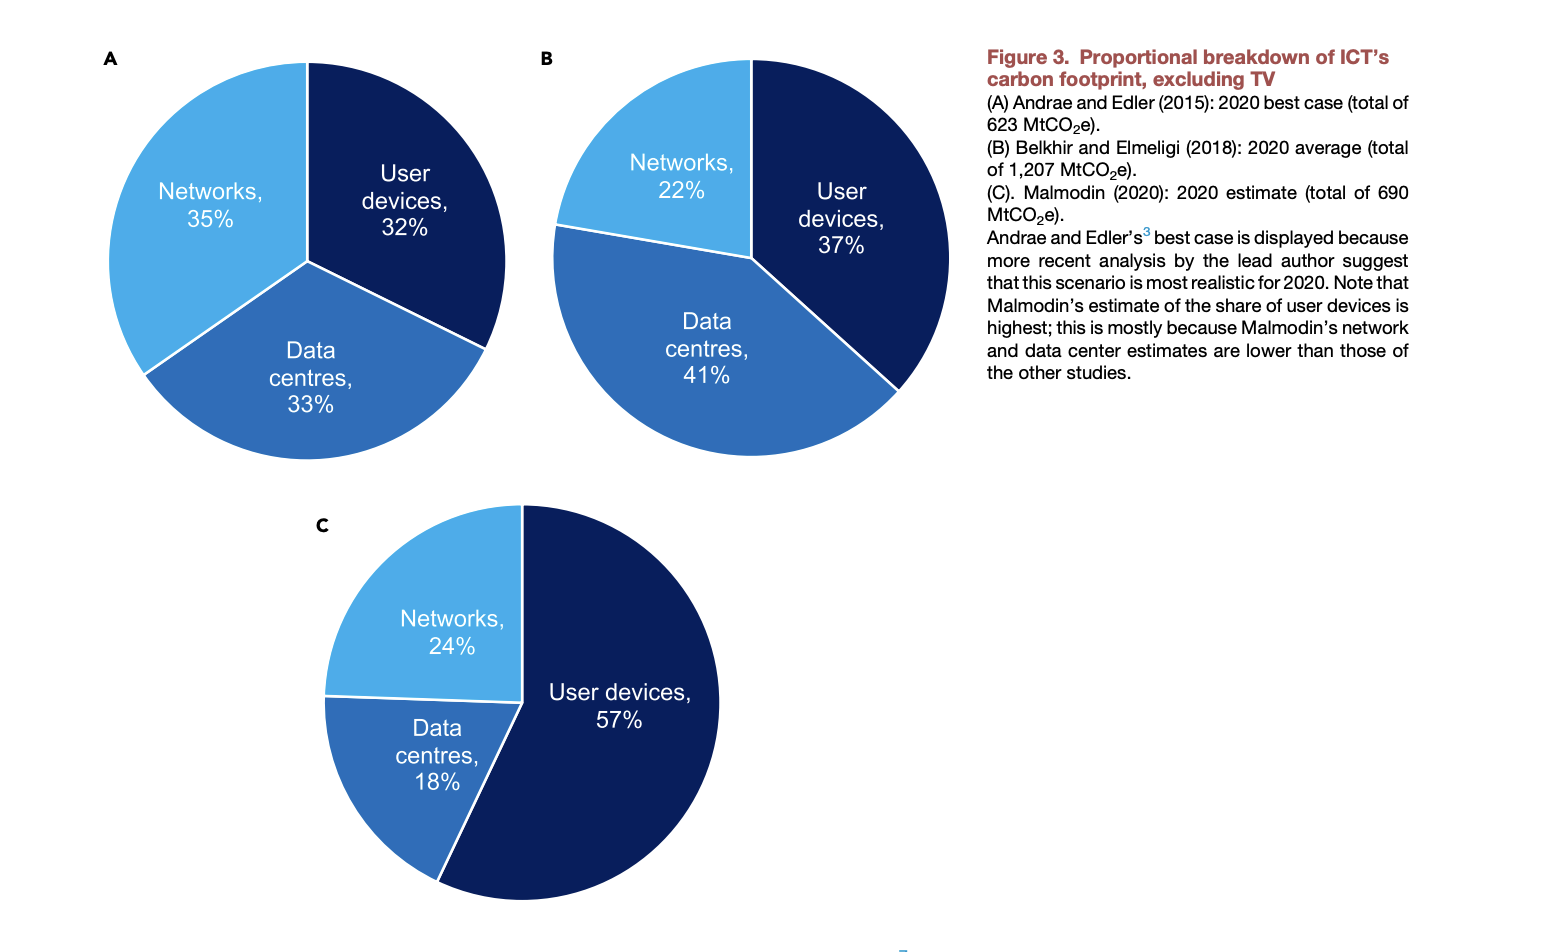
According to the Sustainable Web Design Model, 82% of emissions from networks may be operational emissions:
| Data Centers | Networks | User Devices | |
|---|---|---|---|
| Operational Emissions | 82% | 82% | 49% |
| Embodied Emissions | 18% | 18% | 51% |
In other words, this suggested that operational decisions—rather than hardware construction—accounted for the vast majority of network emissions and could offer significant optimization potential. This led to exploring how networking activity could be measured and optimized.
Inspiration
In the Winter 2025 academic quarter, I participated in CS249I: The Modern Internet, an advanced networking course covering how the Internet has evolved and operates today.
In the first lecture, Professor Zakir Durumeric explained:
"There is no money amounts in routing tables, but you can assign preferences to determine where should traffic be sent."
This prompted the question of whether sustainability could inform Internet traffic routing.
Then, in Lecture 11, guest lecturer Tommy Pauly said:
"There is a big history of internet security and all the different ways we can improve protocols and security aspects if we have great security analysis tools. And then there is privacy which is growing in importance and consideration but is still less mature in terms of how we think about it, how we analyze it, and how we can achieve it."
This led to the further question of whether sustainability could become another critical dimension in Internet protocol design.
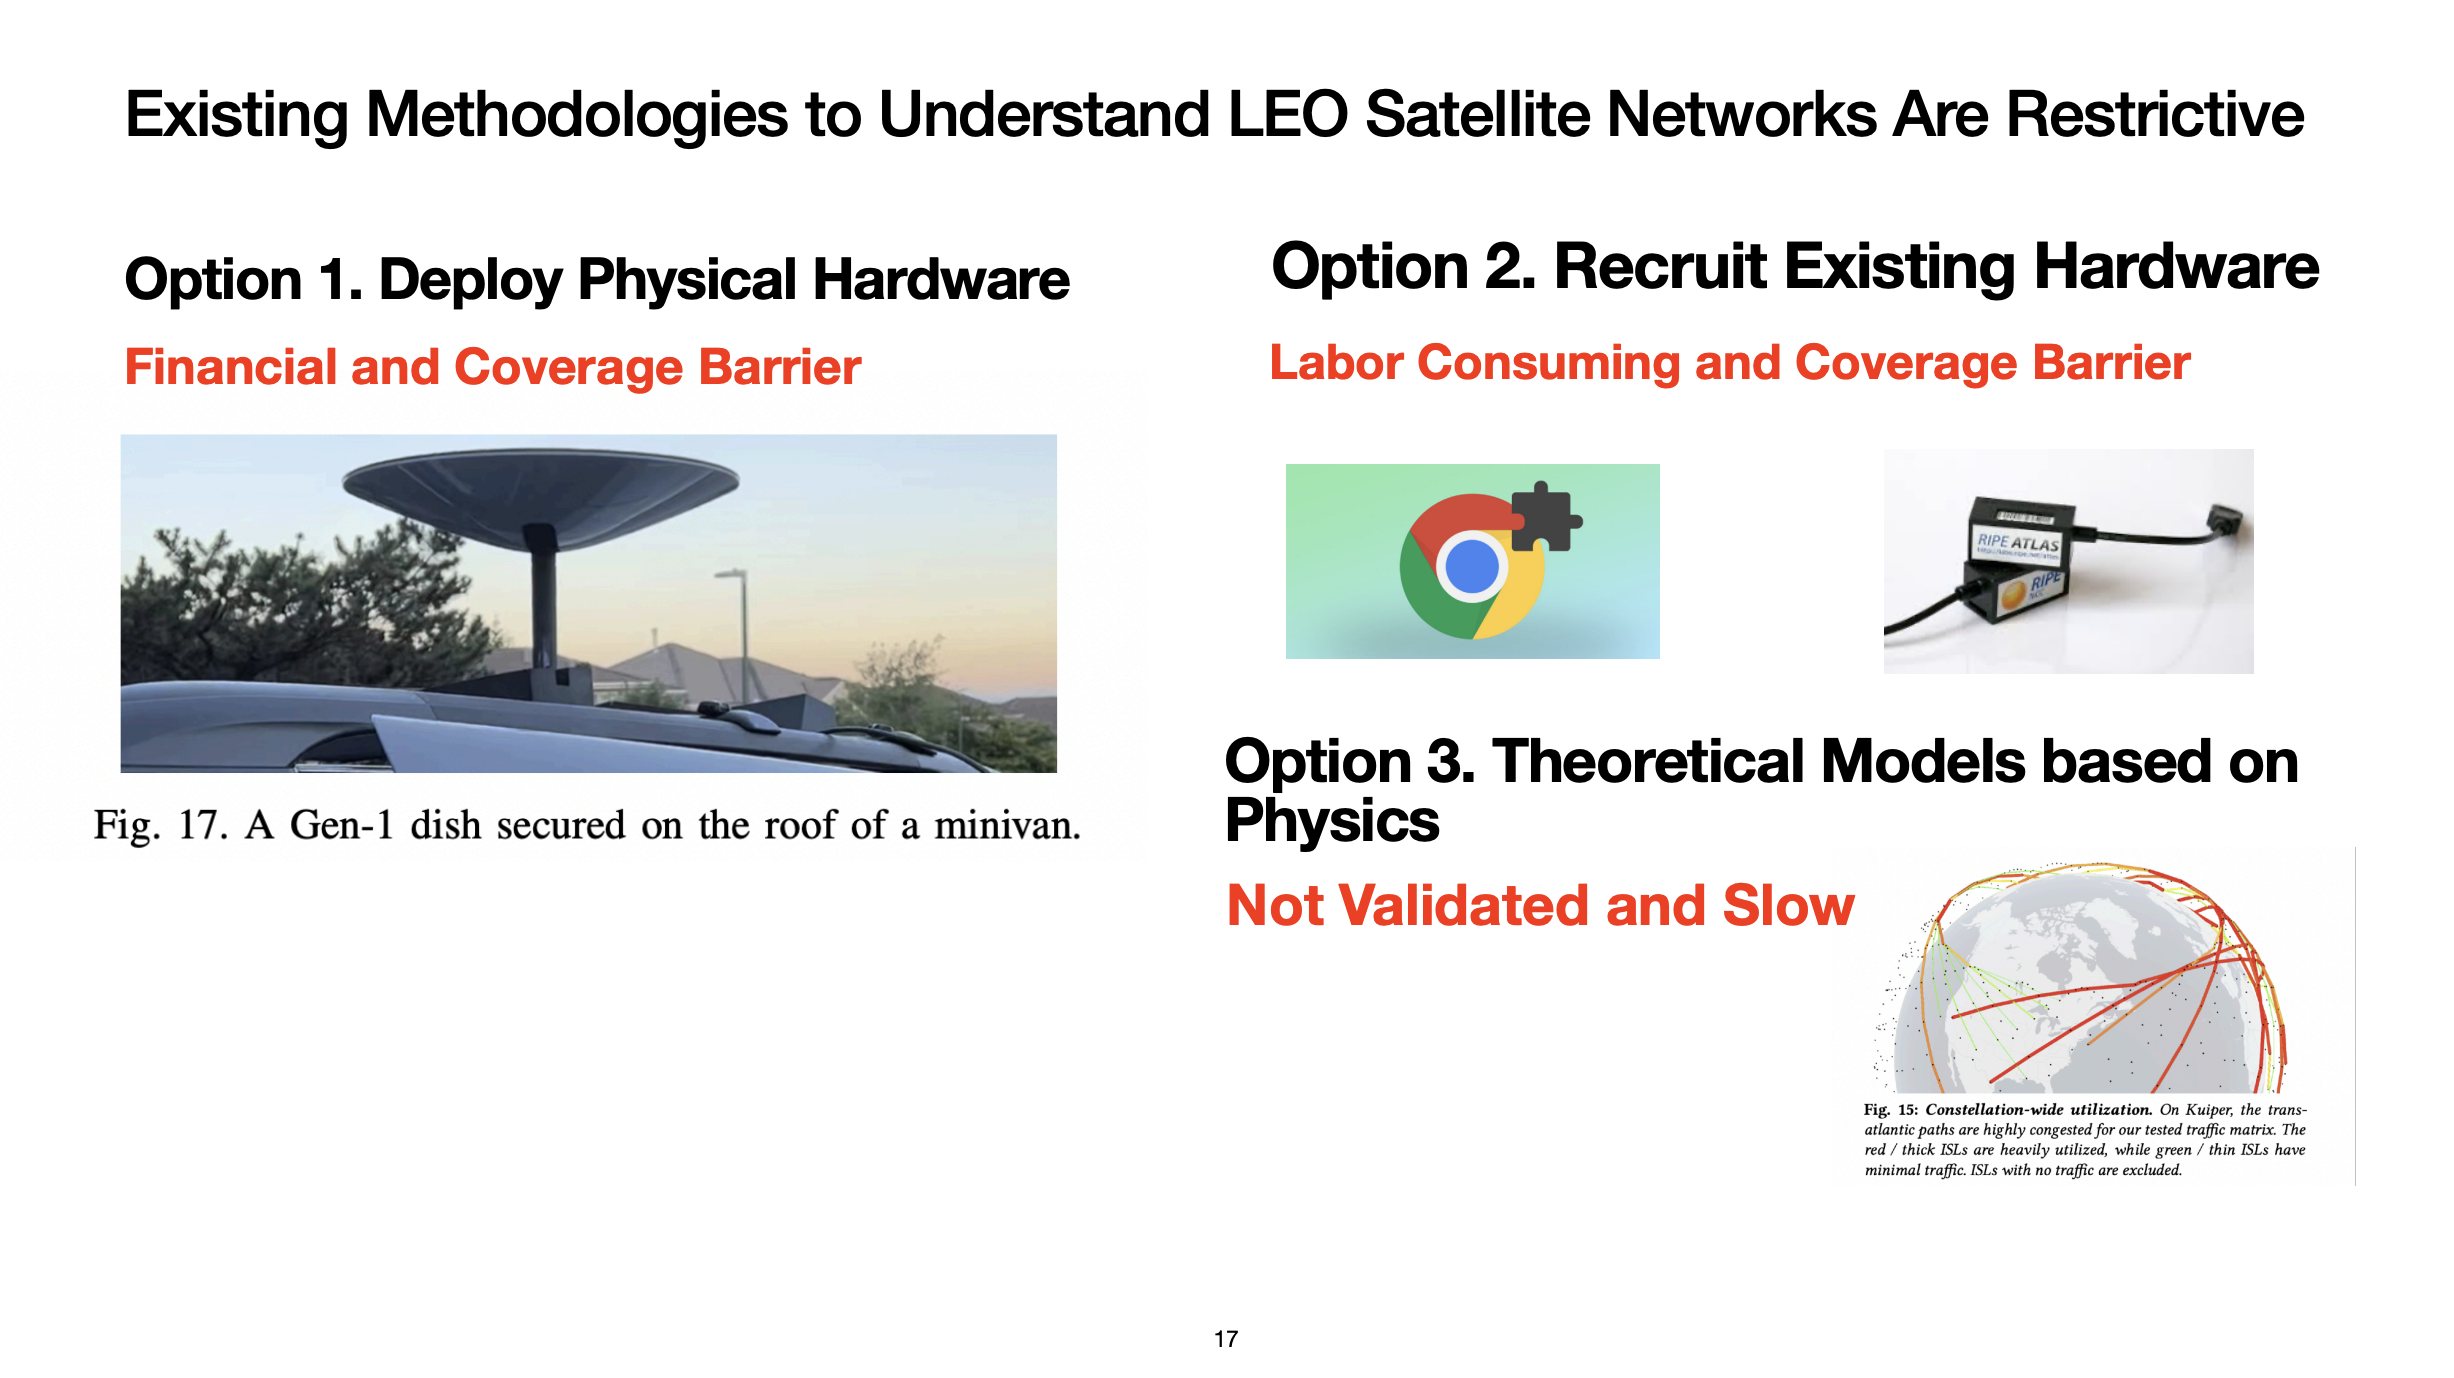
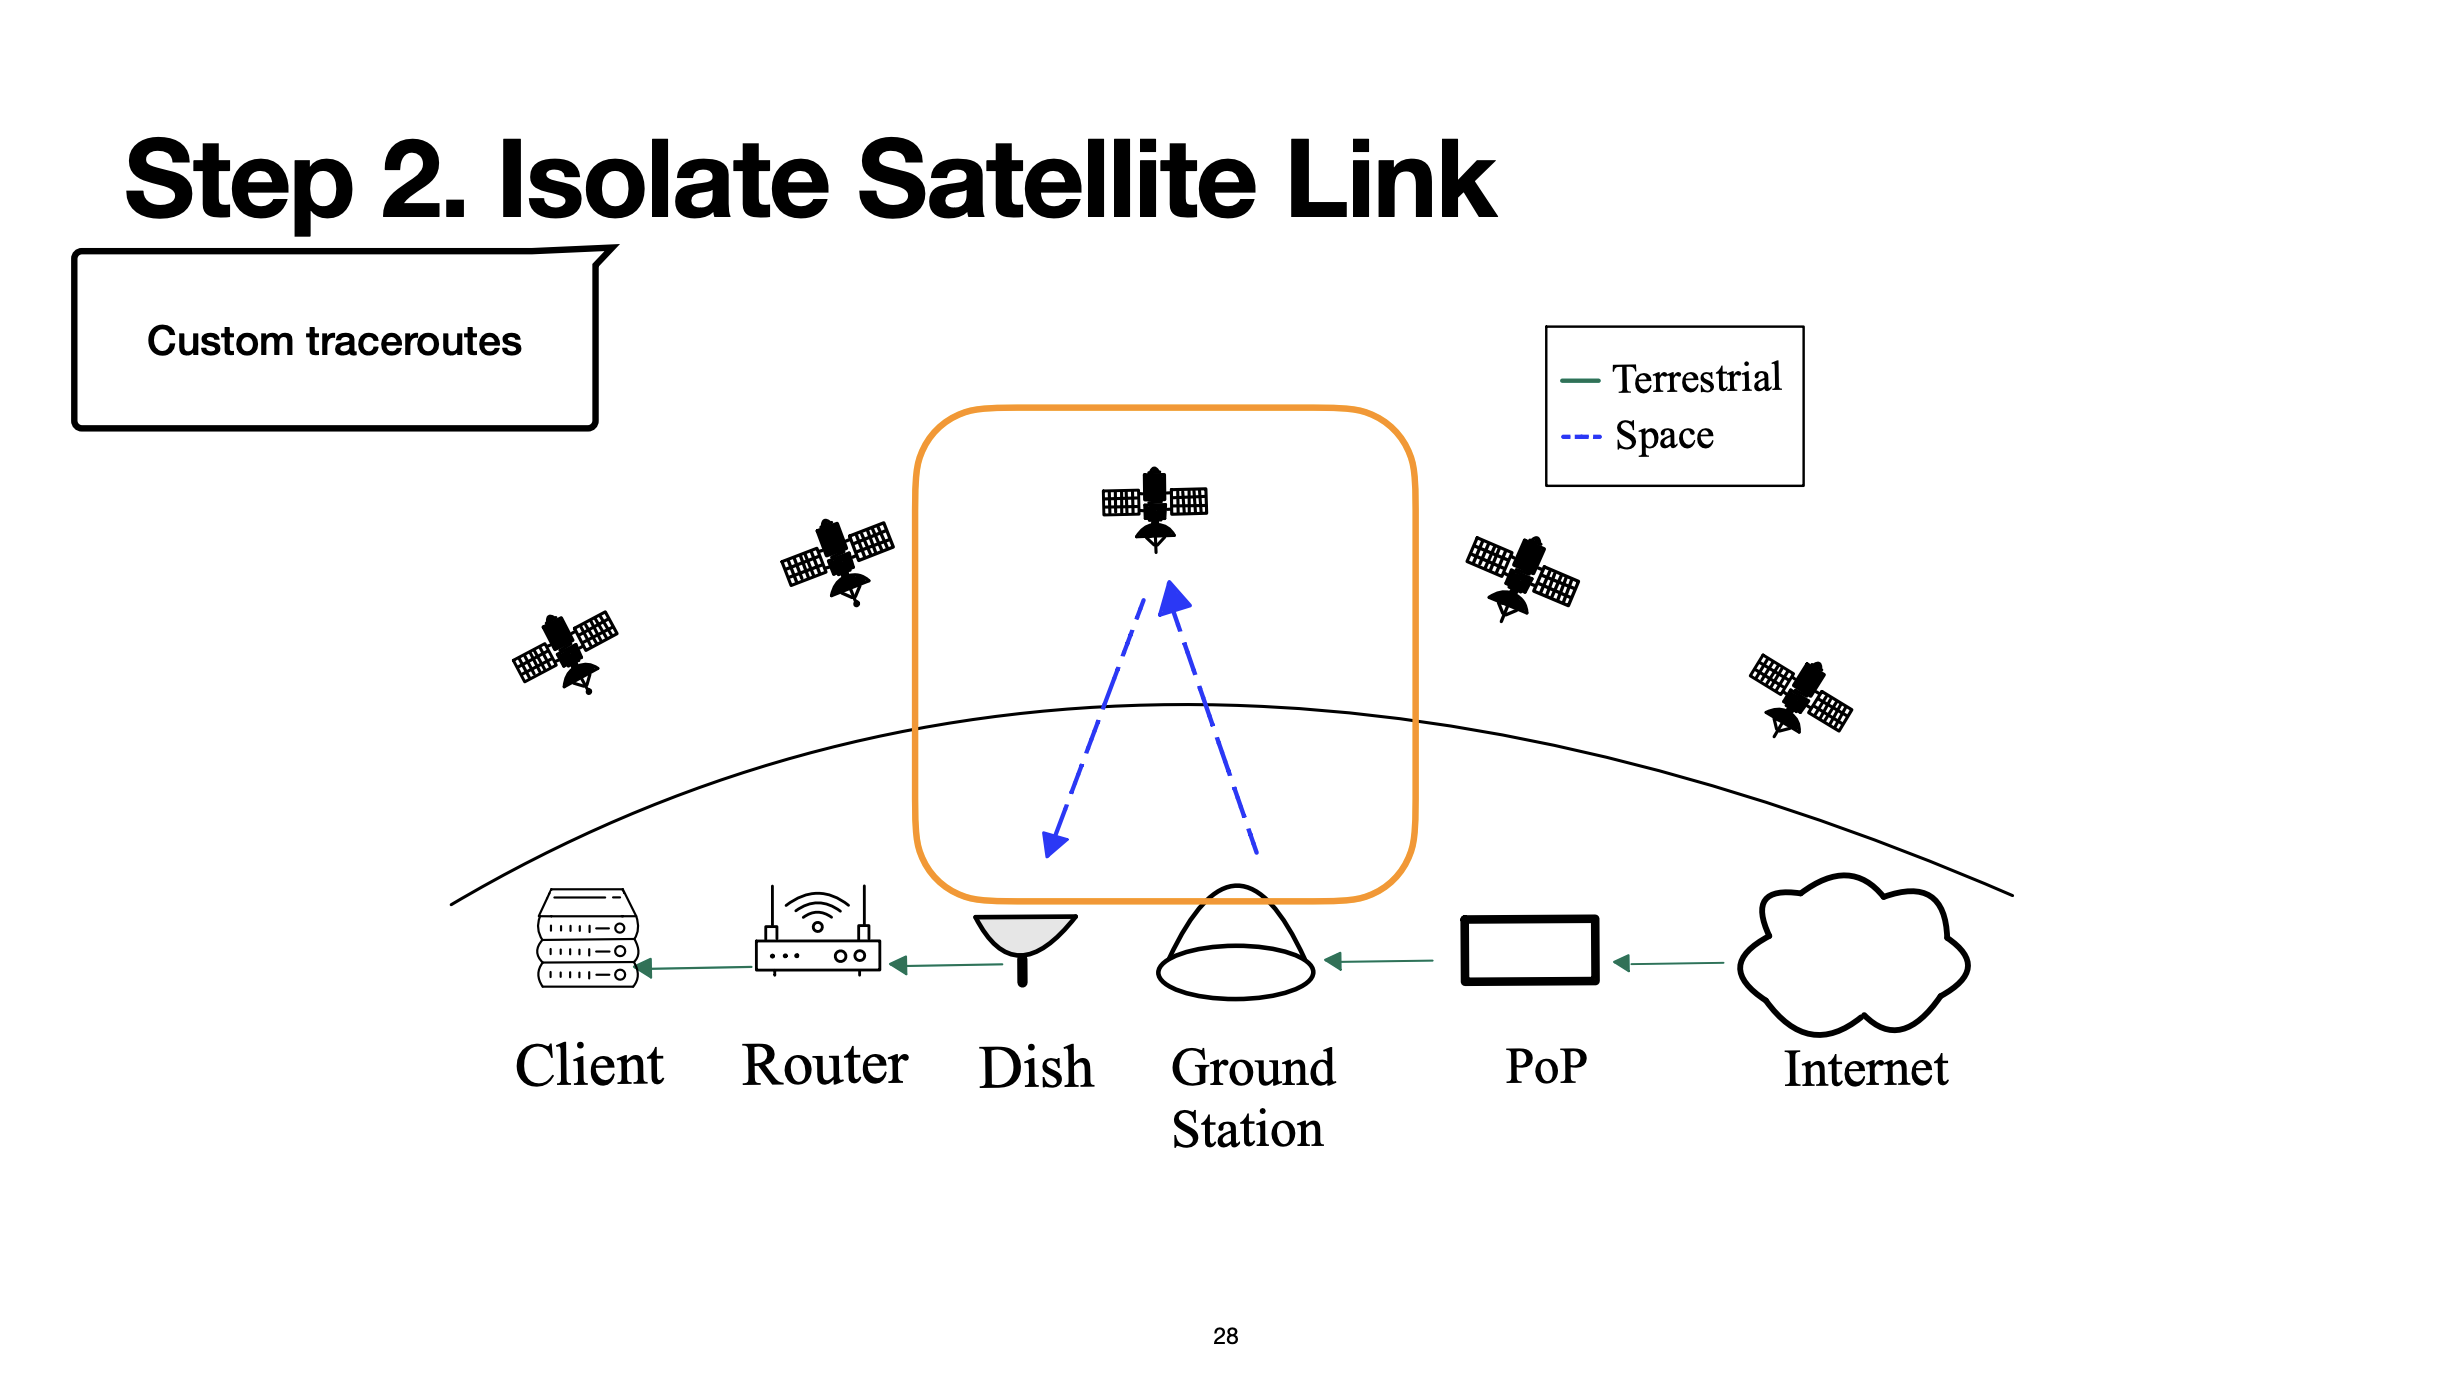
In Lecture 16, guest lecturer Liz Izhikevich presented HitchHiking, an innovative methodology developed to measure LEO satellite networks globally using custom traceroutes, as detailed in the 2023 paper Democratizing LEO Satellite Network Measurement:

Having completed three mini-research projects in the course, I sought to leverage the techniques learned to address two primary research questions:
- How can Internet traffic routing decisions be optimized in real-time to minimize energy consumption?
- What trade-offs emerge between sustainability and conventional network performance metrics (e.g., latency, throughput, and reliability)?
Challenge
Obtaining accurate sustainability data at the network level is challenging due to limited publicly available information:
- Routing tables (e.g., from RouteViews) provide routes as AS number paths, not directly linked to geographic locations.
- Grid carbon intensity data typically represents regions, not ASes or IP addresses specifically.
Thus, mapping ASes or IP addresses to geographic regions is necessary to effectively integrate these data sources.
Ideal Output
Ideally, this research project would yield:
- A novel dataset providing energy efficiency metrics for IP addresses, ASes, or network paths.
- A comparative analysis, presented as an online, interactive visualization benchmarking sustainable routes against performance-optimized routes.
- An algorithm/protocol dynamically selecting network routes based on sustainability metrics.
- An API service that recommends energy-efficient routes for specific IP addresses.
Proposed Methodology
The proposed methodology included:
- Trace Network Paths: Identify IP-level paths to popular destinations via traceroute.
- Extract IPs and ASNs: Map each IP to its ASN using IP-ASN databases.
- Geolocate Each Hop: Determine geographic coordinates of IPs using the IPinfo API.
- Match Electricity Zones: Associate each IP location with a regional electricity zone via WattTime API.
- Integrate Sustainability Data: Acquire real-time carbon intensity data for each region from WattTime.
- Compute Route Metrics: Calculate average carbon intensity and coverage index for each route.
- Visualize Sustainability: Compare sustainability profiles of routes across origins and services.
- Explore Tradeoffs: Analyze how sustainable paths compare in latency and geographic span.
- Assess Feasibility: Evaluate practical incentives and implications for adopting sustainable routing.
Implementation
A functional Python prototype was developed, implementing this methodology:
- Users input a URL.
- Conduct traceroute to the URL.
- Retrieve geographic and energy data per hop via IPinfo and WattTime APIs.
- Aggregate data into a sustainability metric.
Here is a sample output from this program:
Enter destination (e.g., google.com): google.com

Analyzing sustainability of route to: google.com

Tracing route to google.com...
traceroute to google.com (142.250.64.238), 64 hops max, 40 byte packets
1  192.168.1.1  2.533 ms  2.087 ms  2.476 ms
2  96.120.37.9  29.586 ms  21.938 ms  21.914 ms
3  96.110.111.81  22.200 ms  105.354 ms  26.457 ms
4  69.139.181.157  22.160 ms  22.025 ms  22.382 ms
5  68.85.229.225  32.509 ms  33.000 ms  21.607 ms
6  * * 96.110.45.77  24.971 ms
7  96.110.33.170  33.055 ms 96.110.33.162  21.911 ms 96.110.33.166  34.083 ms
8  * * *
9  * * 192.178.109.73  30.971 ms
10  108.170.225.183  33.039 ms 74.125.37.157  22.858 ms  33.074 ms
11  142.250.64.238  21.780 ms
108.170.225.183  33.090 ms
142.250.64.238  24.531 ms

Total hops (including hops without IP): 17

Raw route hops:
{'hop': 1, 'ip': None}
{'hop': 2, 'ip': '192.168.1.1'}
{'hop': 3, 'ip': '96.120.37.9'}
{'hop': 4, 'ip': '96.110.111.81'}
{'hop': 5, 'ip': '69.139.181.157'}
{'hop': 6, 'ip': '68.85.229.225'}
{'hop': 7, 'ip': '96.110.45.77'}
{'hop': 8, 'ip': '96.110.33.170'}
{'hop': 9, 'ip': '96.110.33.162'}
{'hop': 10, 'ip': '96.110.33.166'}
{'hop': 11, 'ip': None}
{'hop': 12, 'ip': '192.178.109.73'}
{'hop': 13, 'ip': '108.170.225.183'}
{'hop': 14, 'ip': '74.125.37.157'}
{'hop': 15, 'ip': '142.250.64.238'}
{'hop': 16, 'ip': '108.170.225.183'}
{'hop': 17, 'ip': '142.250.64.238'}

Enriched hop data:
{'hop': 1, 'ip': None, 'geo': None, 'asn': None, 'raw_ipinfo': None}
{'hop': 2, 'ip': '192.168.1.1', 'geo': None, 'asn': None, 'raw_ipinfo': {'ip': '192.168.1.1', 'lat': None, 'lon': None, 'asn': None, 'raw': {'ip': '192.168.1.1', 'bogon': True}}}
{'hop': 3, 'ip': '96.120.37.9', 'geo': (39.934, -74.891), 'asn': 7922, 'raw_ipinfo': {'ip': '96.120.37.9', 'lat': 39.934, 'lon': -74.891, 'asn': 7922, 'raw': {'ip': '96.120.37.9', 'city': 'Mount Laurel', 'region': 'New Jersey', 'country': 'US', 'loc': '39.9340,-74.8910', 'org': 'AS7922 Comcast Cable Communications, LLC', 'postal': '08054', 'timezone': 'America/New_York'}}}
...
{'hop': 17, 'ip': '142.250.64.238', 'geo': (25.7743, -80.1937), 'asn': 15169, 'raw_ipinfo': {'ip': '142.250.64.238', 'lat': 25.7743, 'lon': -80.1937, 'asn': 15169, 'raw': {'ip': '142.250.64.238', 'hostname': 'mia07s57-in-f14.1e100.net', 'city': 'Miami', 'region': 'Florida', 'country': 'US', 'loc': '25.7743,-80.1937', 'org': 'AS15169 Google LLC', 'postal': '33101', 'timezone': 'America/New_York'}}}

Obtaining WattTime access token...
Hop 1 has no geolocation data.
Hop 2 has no geolocation data.

Processing hop 3 - IP: 96.120.37.9, Coordinates: (39.934, -74.891)
  Grid region: PJM_NJ
  Forecast for hop 3 in region PJM_NJ: {'point_time': '2025-04-29T15:25:00+00:00', 'value': 1318.0}

...

Processing hop 17 - IP: 142.250.64.238, Coordinates: (25.7743, -80.1937)
  Grid region: FPL
  Forecast for hop 17 in region FPL: {'point_time': '2025-04-29T15:25:00+00:00', 'value': 856.8}

Final enriched route data with WattTime forecasts:
{'hop': 1, 'ip': None, 'geo': None, 'asn': None, 'raw_ipinfo': None, 'forecast': None}
{'hop': 2, 'ip': '192.168.1.1', 'geo': None, 'asn': None, 'raw_ipinfo': {'ip': '192.168.1.1', 'lat': None, 'lon': None, 'asn': None, 'raw': {'ip': '192.168.1.1', 'bogon': True}}, 'forecast': None}
{'hop': 3, 'ip': '96.120.37.9', 'geo': (39.934, -74.891), 'asn': 7922, 'raw_ipinfo': {'ip': '96.120.37.9', 'lat': 39.934, 'lon': -74.891, 'asn': 7922, 'raw': {'ip': '96.120.37.9', 'city': 'Mount Laurel', 'region': 'New Jersey', 'country': 'US', 'loc': '39.9340,-74.8910', 'org': 'AS7922 Comcast Cable Communications, LLC', 'postal': '08054', 'timezone': 'America/New_York'}}, 'forecast': {'point_time': '2025-04-29T15:25:00+00:00', 'value': 1318.0}}
...
{'hop': 17, 'ip': '142.250.64.238', 'geo': (25.7743, -80.1937), 'asn': 15169, 'raw_ipinfo': {'ip': '142.250.64.238', 'lat': 25.7743, 'lon': -80.1937, 'asn': 15169, 'raw': {'ip': '142.250.64.238', 'hostname': 'mia07s57-in-f14.1e100.net', 'city': 'Miami', 'region': 'Florida', 'country': 'US', 'loc': '25.7743,-80.1937', 'org': 'AS15169 Google LLC', 'postal': '33101', 'timezone': 'America/New_York'}}, 'forecast': {'point_time': '2025-04-29T15:25:00+00:00', 'value': 856.8}}

Aggregate Route Sustainability Metrics:
  Average Carbon Intensity: 889.74 gCO2eq/kWh
  Coverage Index: 82.35%
Observed Limitations
Despite a successful implementation, this initial approach revealed practical limitations:
-
Limited Geographic Resolution: Energy zones provided by WattTime turned out to be much larger than initially anticipated, lacking the granular accuracy required for hop-by-hop IP analysis. For instance, multiple IP addresses across extensive regions like Florida (in the sample output) returned identical energy efficiency scores, preventing meaningful differentiation between specific routing paths.
-
Insufficient Differentiation Between Routes: Due to broad geographic zones, distinct network routes appeared similarly efficient, undermining the project's original intent to identify more sustainable routing choices. The issue is amplified by the fact that approximately 70% of web traffic is currently routes through cloud providers and cloud delivery networks, which tend to serve websites (such as
google.comin the sample output) via points of presence close to the user, i.e. most likely in the same energy zone from which the request originated.
Moving Forward
The identified limitations have sparked valuable reflection, feedback, and crucial questions from members of the Stanford CS249I teaching team. As a next step, our focus shifts to these insights, specifically addressing questions raised during academic interactions and documenting ongoing research efforts directed toward refining and expanding the project's scope.